
How To Use Gold As A Hedge Against Inflation
Erez Katz, CEO and Co-founder of Lucena Research
The price of gold has been traditionally perceived as inversely correlated to the price of the US dollar and therefore has been used as a hedge against inflation. That correlation has held well over longer time frames but has been proven less predictive over shorter periods.
Over time, gold has been transitioned from a US dollar currency alternative into a hedge against the major indexes such as the S&P or the Dow.

A one-year chart comparing GLD, SPDR Gold Trust (ETF) to UUP PowerShares DB US Dollar Index Bullish. See how inversely correlated the price charts are. From Google Finance. Past performance is not indicative of future returns.
By applying machine learning and utilizing Quantitative research, a successful hedge against inflation can be achieved. For this example I will be using our AI investment research platform QuantDesk® to effectively construct a hedge against the S&P 500 that is based on gold, or more specifically GLD, the SPDR Gold Trust ETF.
Believe it or not, you can have long hedge positions.
Studies conducted by our research team indicate selecting certain constituents that traditionally are highly correlated to gold and using them as a dynamic hedge against SPY actually produces superior results to simply buying and holding SPY.
While many attribute hedges to shorting a position or buying protective puts that reduce returns in favor of lower volatility, our approach is different. We advocate identifying a set of securities that will both reduce volatility and advance returns.
Steps to Build and Hedge Using Gold Against Inflation:
- Utilize QuantDesk’s portfolio replication technology to construct a replica of GLD from the Russell 1K.
- Use the constituents identified as a whitelist from which to construct a hedge for SPY.
- Backtest this method over different market regimes in order to evaluate if it is effective over time.
- If effective, construct a model portfolio using the same rules on which the backtest was predicated.
- If it continues to perform as expected, consider incorporating the above process slowly into a live portfolio.
Step 1 - Replicating GLD:
Lucena’s portfolio replicator attempts to track a time series chart (GLD in our case) by constructing a collection of securities and their allocations that together minimize tracking error over a time period (training period). In the scree below, we have ten securities from the Russell that together highly correlate to GLD or more specifically track the historical time series of GLD.
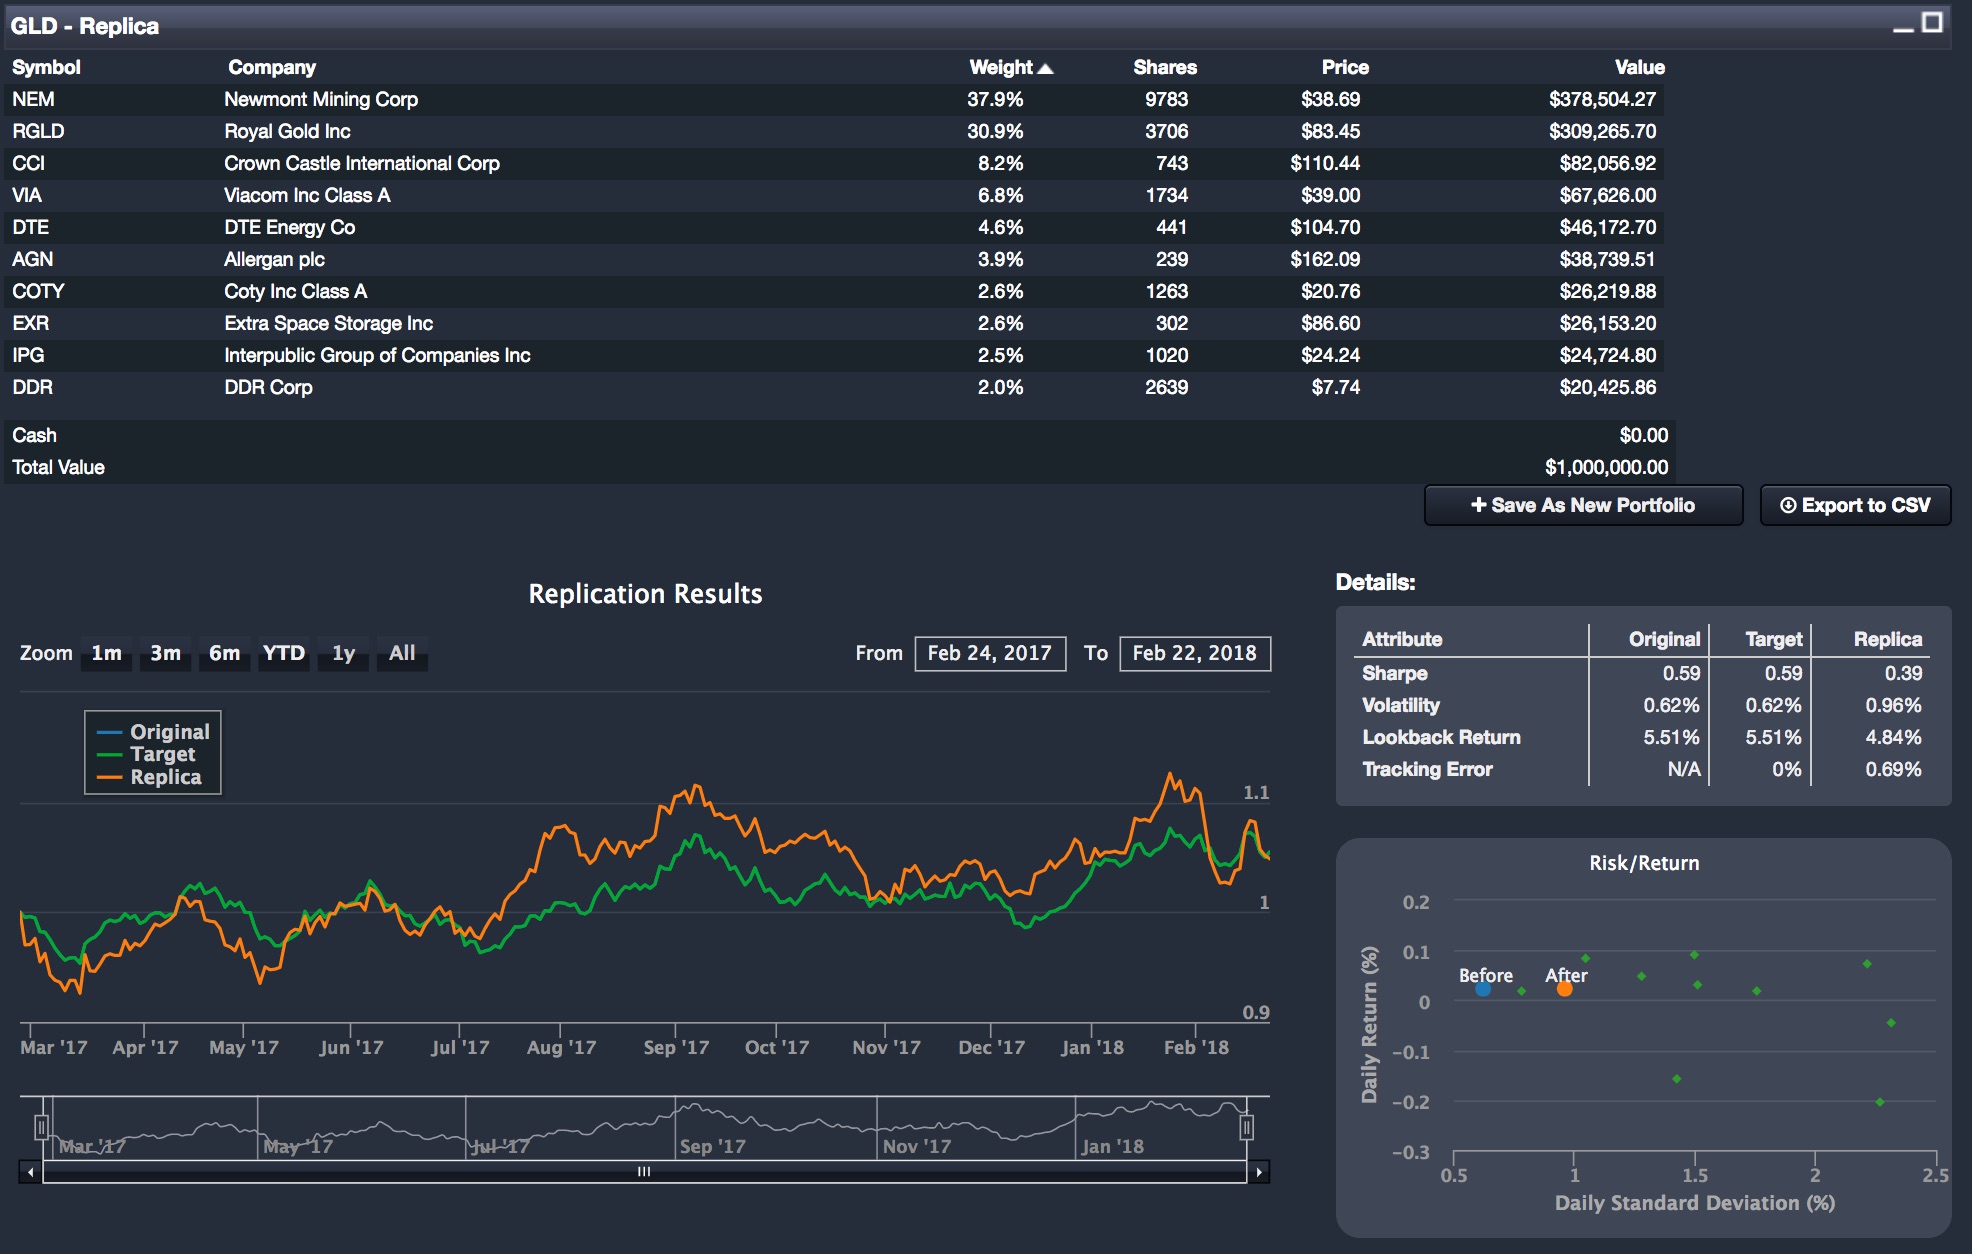
A one-year to present chart comparing GLD to the replica portfolio. See list of selected constituents:
Not surprisingly the replication engine selected NEM and RGLD (together constitutes 68.6% of the portfolio) but also unrelated securities with much lower allocations that together fine-tunes the price correlation for GLD.
Step 2 – Hedging SPY With Our GLD Replica Constituents:
Here is an overview of how the Hedger is able to construct hedges using Lucena’s pattern recognition technology. An investment strategy can be built, backtested and deployed before capital and resources are risked. The hedger goes to work and identifies which constituents and their allocations serve as the best hedge for a maximum projected Sharpe ratio.
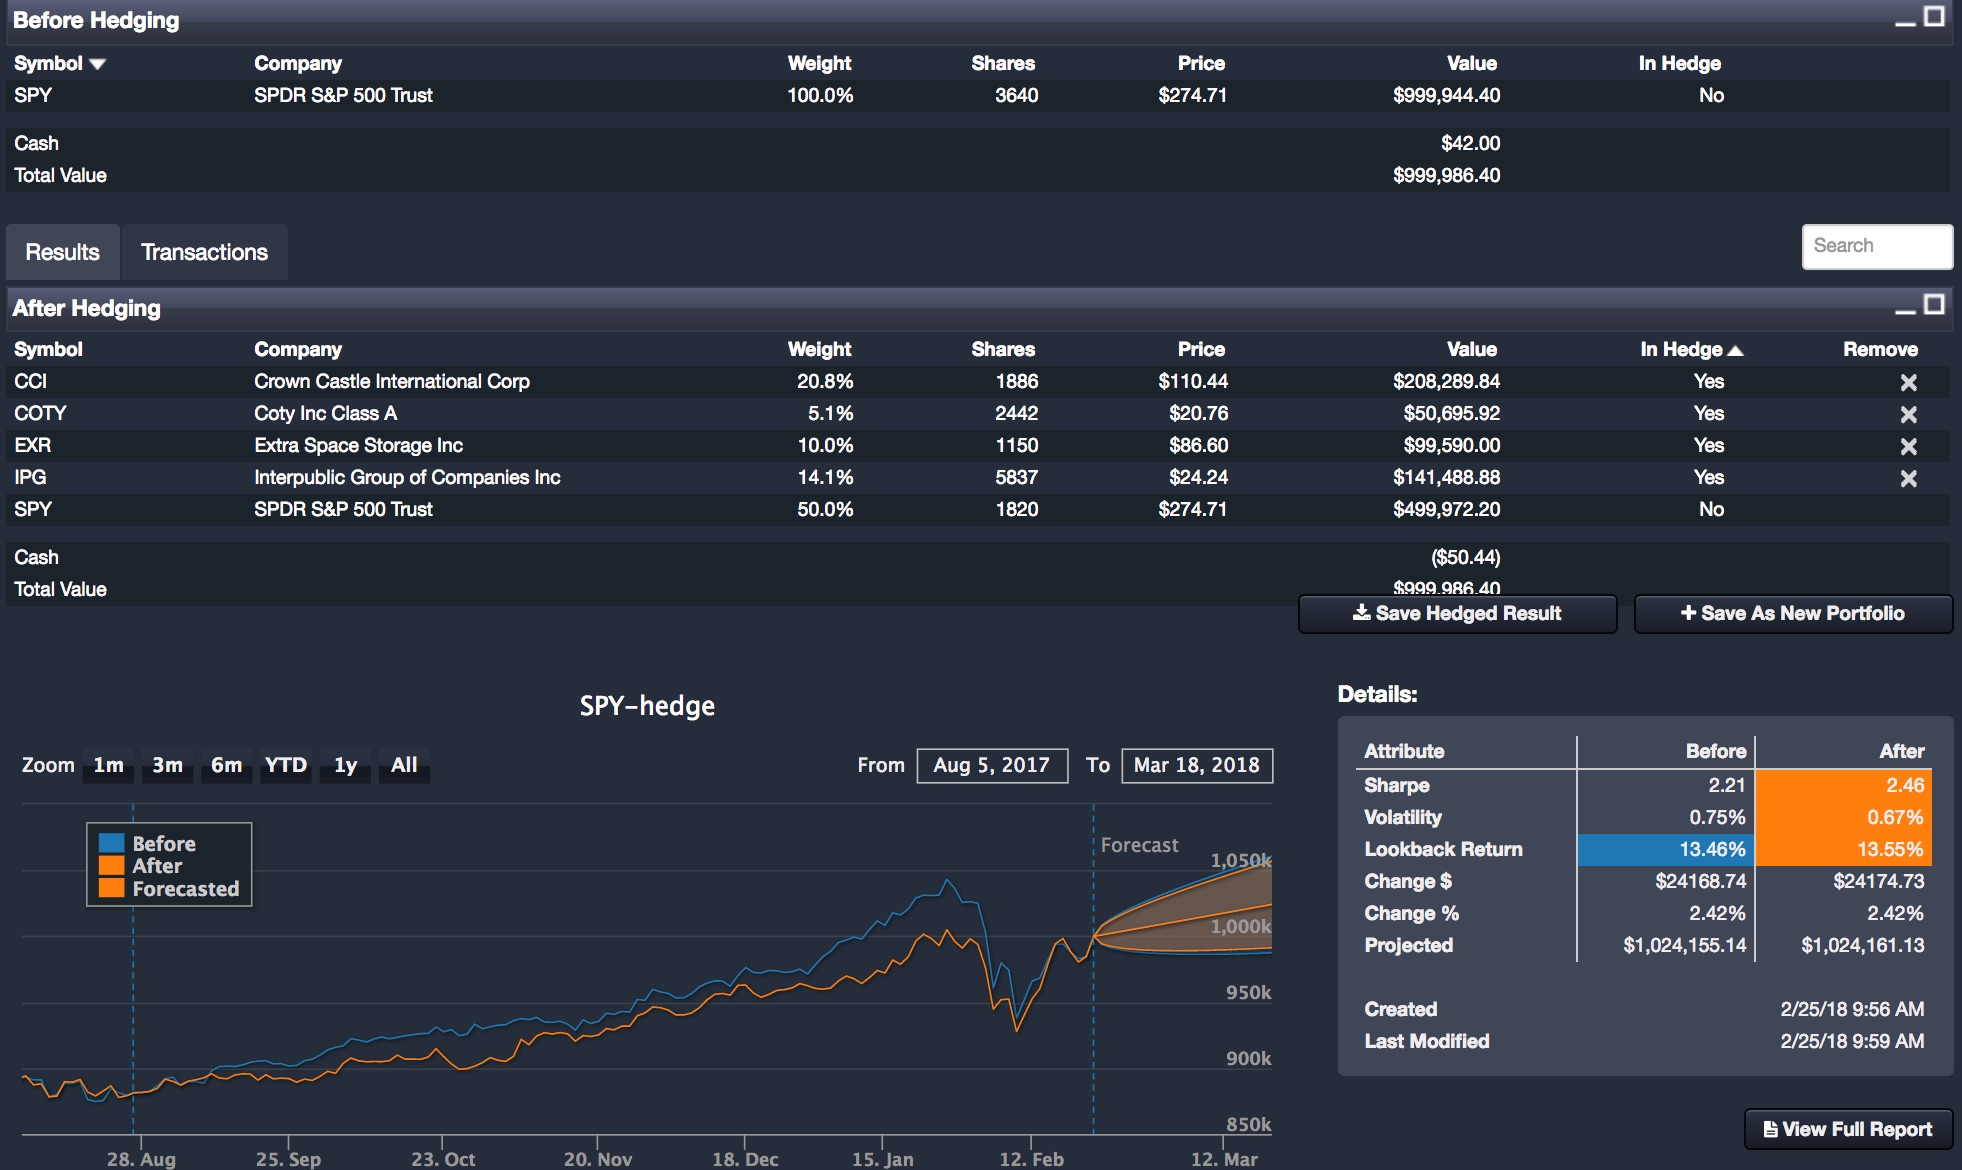
The top panel shows the original portfolio which consists of one position at 100% allocation, namely SPY. The second panel below titled: After Hedging showcases the portfolio in which SPY was reduced to 50% allocation and the remaining 50% is distributed between the hedge positions selected by our hedge finder.
As you can see in the table marked in orange, we were able to enhance the Sharpe, reduce the volatility and even slightly increase the total returns.
Step 3 – Backtesting Our Hedging Process Over Time:
Now we can test our strategy with the Hedger Backtester from 1/1/2010 to 2/25/18. The portfolio rebalances every 4 weeks with up to 5 long only constituents. After a short run, the screen updates with the following results:
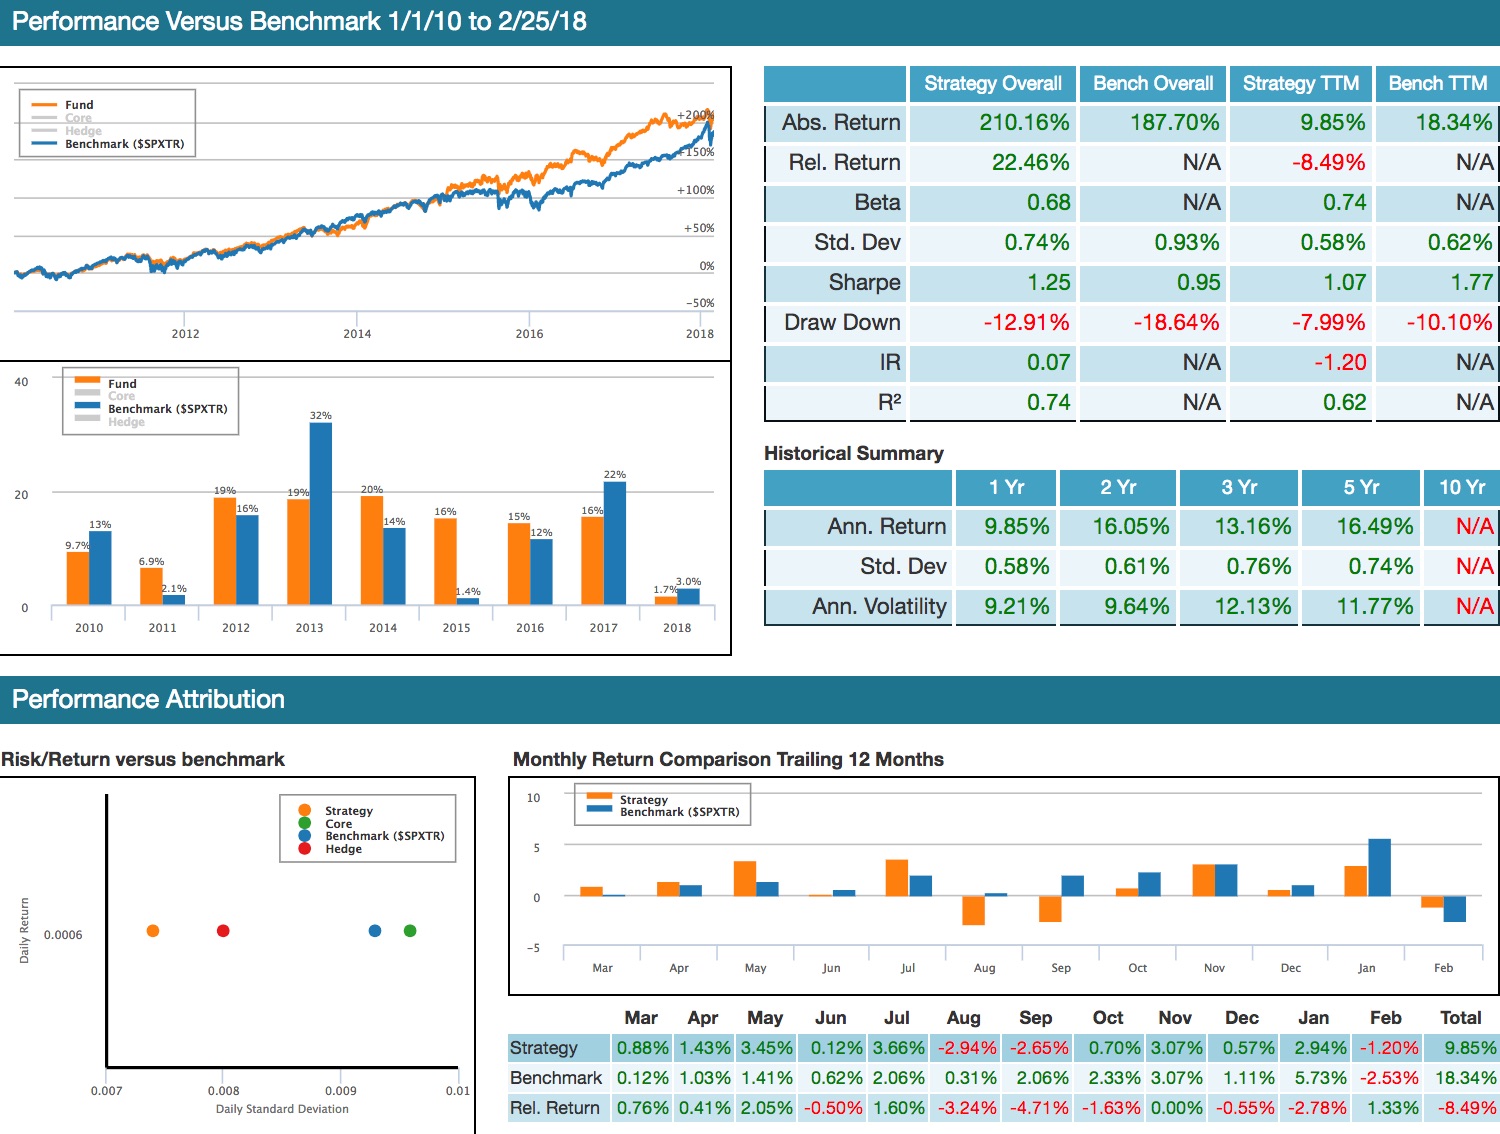
The hedging backtest results present a compelling validation. The backtest presents a higher Sharpe of 1.25 vs. 0.95 for the SPY. A higher return of 210% vs. 187% for the SPY and a lower max drawdown of 12.91 vs. 18.64% for the SPY. Results are net of slippage and transactions cost. Past performance is not indicative of future returns.
Construct A Model Portfolio For Forward Trading
Now that we have a compelling case for hedging SPY, the backtest can easily be converted to a live portfolio to start trading.
QuantDesk has hundreds of unique datasets, and not only aggregates alternative data sources but also enables mobilization of such data with advanced machine learning technology.
Interested in testing your own investment strategies?
Here is your free trial of QuantDesk.
Want to learn more about the future of stock forecasting?
Watch: Applying Deep Reinforcement Learning to Trading
with Co-founder Dr. Tucker Balch!
Read More About Similar Topics:

Why You Should Be Using A Genetic Algorithm for Feature Selection
Erez Katz, CEO and Co-founder of Lucena Research At Lucena our mission is to democratize some of the best kept secrets in the Financial industry and refute the “black-box” image often associated with Machine Learning. In that spirit, I wanted to share with you an...
read more
How Machine Learning Can Validate Your Data For Stock Forecasting
How To Validate Alternative Data for Stock Forecasting Erez Katz, CEO and Co-founder of Lucena Research There are many different Machine Learning methods that can be utilized for stock forecasting. A few we recently discussed use neural networks with time series...
read more
Data Science: A Prerequisite to Machine Learning
Erez Katz, CEO and Co-founder of Lucena Research. The rapid growth of big data has resulted in a technology and AI arms race. In the past, being an AI player would typically earn you a new level of professional esteem but big data, data science and machine learning...
read more
Is Your Data Predictive? How to Measure Before Risking Capital
Erez Katz, CEO and Co-founder of Lucena Research. At Lucena, our mission is to bridge the gap between validated data and data-driven professionals. Portfolio managers seek reliable ways to efficiently assess and deploy alternative data for investment decision...
read more
Is Your Portfolio Statistically Significant?
Erez Katz, CEO and Co-founder of Lucena Research. Investors often look at Sharpe ratio to determine a portfolio’s strength. (Sharpe ratio measures a portfolio’s risk adjusted return.) The goal of Sharpe ratio is to assess a portfolio’s returns discounted against...
read more