QuantDesk® Machine Learning Forecast
for the Week of July 6
Analysis
As I write this newsletter, the Greek debt negotiations and its creditors seem to have come to an impasse, and its exit from the euro zone seems imminent. My opinion is that in spite of robust domestic economic data (healthy consumer spending, an increase in home sales, and the revised first quarter’s upwards GDP) the relative calm and low volatility is about to be disturbed by international geopolitical developments. The Greek fiasco, the unavoidable fed tightening and rising global terrorism means we are heading for a bumpy ride.
Last week, US stocks indexes ended moderately lower while at Lucena Tiebreaker continued to march upwards, reaching new all-time highs while maintaining its market neutrality. In contrast, BlackDog struggled due to its sizeable exposure to fixed income securities which remain under pressure in anticipation of the Fed’s imminent tightening. In spite of its recent drawdown, BlackDog continues to outperform the S&P handsomely since its inception on April 2014. We expect BlackDog’s unique anti-correlation attributes to firm up and resume its strong performance as soon as the Fed makes a clear policy move on interest rates.
Tiebreaker has been a consistent outperformer and last week was no exception. In fact, Tiebreaker followed last week’s 1.97% return with another 1.27%, marking its best back-to-back winning streak since inception.

Image 1: Last week’s change and Year to date gains.
For those of you unfamiliar with BlackDog and Tiebreaker, here is a brief overview:
BlackDog and Tiebreaker are two out of an assortment of model strategies that we deploy for our clients. Our team of quants is constantly on the hunt for innovative investment ideas. Lucena’s model portfolios are a byproduct of some of our best research, packaged into consumable model-portfolios. The performance stats and charts presented here are a reflection of live portfolios tracked on our platform, QuantDesk®. Actual performance of our clients’ portfolios may vary as it is subject to the manager’s discretionary implementation. We will be happy to facilitate an introduction to one of our clients for those of you interested in reviewing live brokerage accounts that track our model portfolios.
BlackDog:
BlackDog is a tactical asset allocation strategy that utilizes highly liquid ETFs of large cap and fixed income instruments. The portfolio is adjusted approximately once per month based on Lucena’s Optimizer in conjunction with Lucena’s macroeconomic ensemble voting model. Due to BlackDog’s low volatility (half the market in backtesting) we leveraged it 2X. By exposing twice its original cash assets, we take full advantage of its potential returns while maintaining market-relative low volatility and risk. As evidenced by the chart below, BlackDog 2X is substantially ahead of its benchmark (S&P 500).
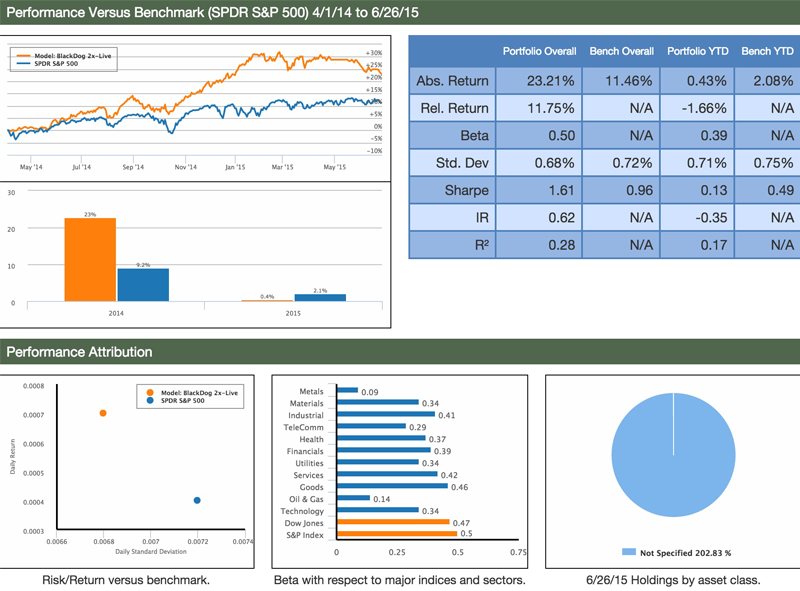
BlackDog: Model portfolio performance compared to the S&P 500 from 4/1/2014 to 6/26/2015.
Past performance is no guarantee of future returns.
TieBreaker:
Tiebreaker is an actively managed market-neutral long/short equity strategy. It invests in equities from the S&P 500 and Russell 1000 and is rebalanced weekly using Lucena’s Forecaster and Optimizer. Tiebreaker splits its cash 50/50 between its core and hedge holdings, and its hedge positions consist of long and short equities identified by QuantDesk® Hedge Finder. Tiebreaker has been able to successfully avoid major market drawdowns while still taking full advantage of subsequent run-ups. The main factor that enables Tiebreaker to perform so well is its ability to adjust its long/short exposure based on idiosyncratic volatility and risk. Lucena’s Hedge Finder is primarily responsible for driving this long/short exposure tilt.
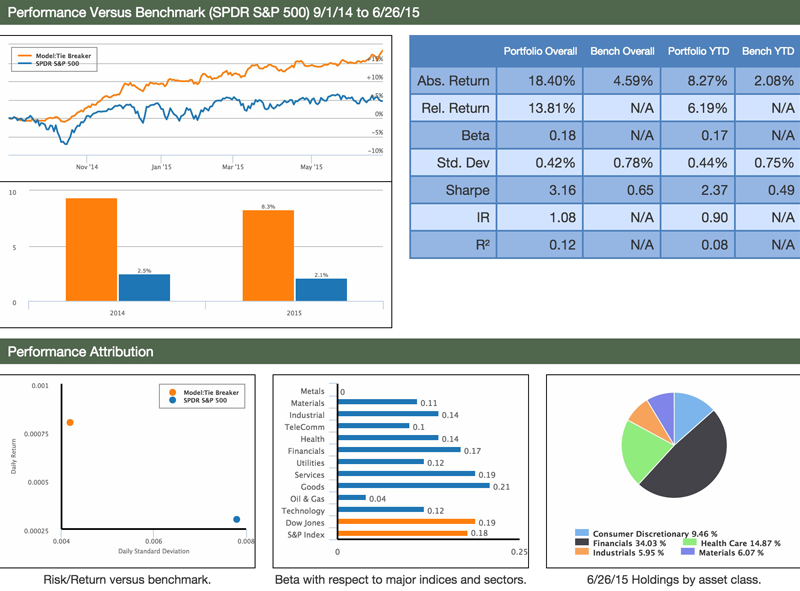
Tiebreaker: Model portfolio performance compared to S&P 500 and the Vanguard Market Neutral Institution fund VMNIX from 9/1/2014 to 6/26/2015.
Past performance is no guarantee of future returns.
I designed, backtested and deployed Tiebreaker utilizing QuantDesk® exclusively. This can serve as an example of how a portfolio manager can take full advantage of Lucena’s technology.
Those of you who have been following us closely must have noticed several recent press releases highlighting Lucena’s partnership with independent and proprietary data providers. Lucena, being a big data analytics business, views these partnerships as highly strategic as they underscore our value proposition, which is to democratize machine-learning decision-making through enabling visual and actionable access to predictive data. In essence, we couple big-data with the technology that empowers our customers to make intelligent and scientific investment decisions.
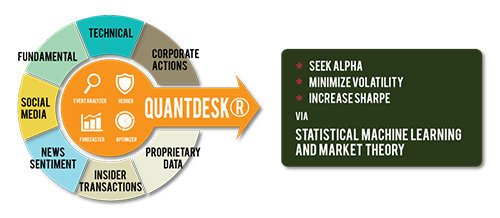
Lucena’s various data sources could feed into a cohesive investment strategy through QuantDesk®
Today, rather than describing how this marriage of predictive big data and the technology suited to analyze such data work in theory, I’d like to showcase how PsychSignal, a social media sentiment data provider, has integrated its data into Lucena’s infrastructure and how such data is consumed directly on our platform, QuantDesk®.
PsychSignal developed a unique approach to assessing social media chatter sentiment through aggregating and analyzing tweets, chats, blogs and other social media chatters in the financial markets. PsychSignal developed expertise that exceed the traditional natural language parsing by quantifying real world crowd psychology through innovative measures of bullishness and bearishness scales towards a subject matter or a particular stock.
At Lucena, our data scientists were able to easily absorb the normalized data and assess if it is indeed predictive. The analysis is rather simple; Lucena’s Event Analyzer can travel through time and assess the price action of stocks that experience a PsychSignal social media sentiment shift over time.
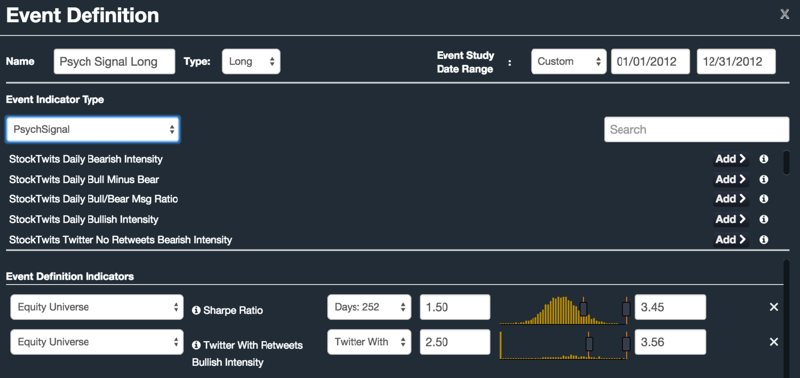
Event definition that assesses price moves of stocks in the S&P 500 after they were assessed Twitter/Re-tweets bullish intensity in 2012. Please note, Lucena’s traditional indicator, Sharpe Ratio that was combined with PsychSignal’s proprietary indicators into one cohesive event study.
Once we executed the event scan and through several refinement iterations, we achieve a fairly compelling result. Measuring the aggregate data of all the stocks that met the scan criteria in 2012 is showcased below:
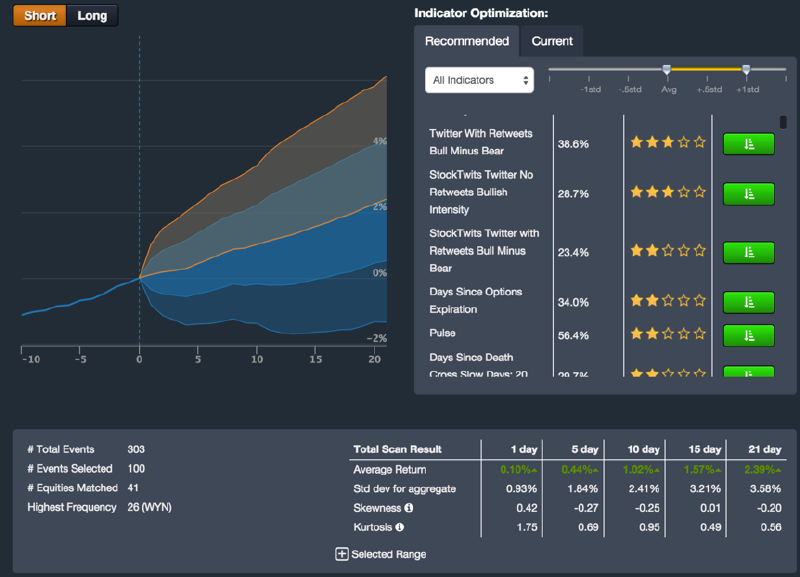
Event Study results: sector heat map that present the average price move by sector 21 days after the event date.

Event Study graph, presenting visually the aggregate price move before the event date (zero line) and up to 21 days after. On the right side, additional indicators recommended by Lucena’s engine that could narrow the scan but at the same time refine further the price move and reduce the margins of error.
Lastly, we took PsychSignal data on a small test drive using QuantDesk® Backtester in order to assess if this strong performance will persist out of sample (in years prior and post 2012). See results below of a backtest that simulates buying every stock that passes the scan criteria between 1/1/2011 and 3/31/2015:
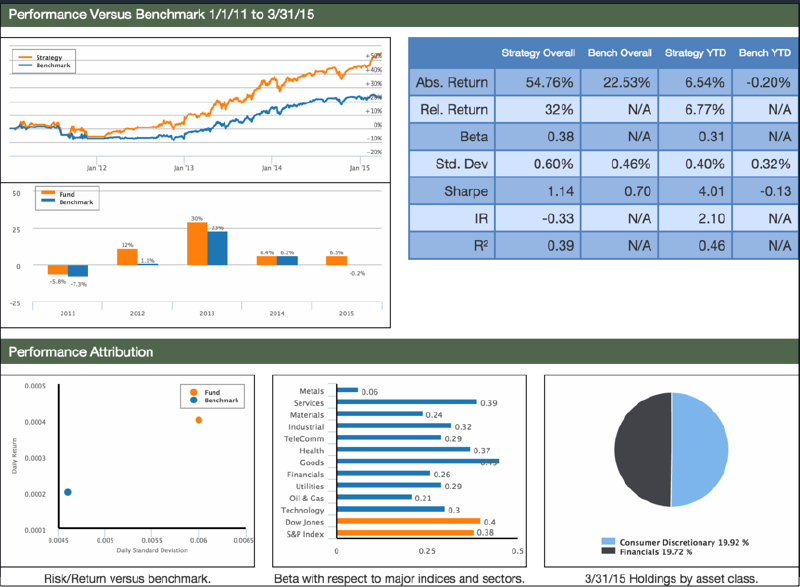
Image above represent the results of a backtest of PsychSignal’s long event. This backtest simulates buying every stock that matched the scan criteria and holding it for 21 days. The trade simulations are compared to the S&P500.
As can be seen, Lucena’s platform supports graphical compilation of event studies based on multiple, independent, data sources. It then provides the mechanism to suggest additional factors that will further refine the scan through machine learning algorithms. Finally, the platform enables validation of the event scan through backtest simulation.
Once an event scan is firmed up, it can then be integrated into a live trading system through intra-day signals signifying new stocks prone to move based on the event’s statistics.
In the past year, we covered QuantDesk’s Forecaster, Back-tester, Optimizer, Hedger and our Event Study. In future briefings, we will keep you up-to-date on how our live portfolios are executing. We will also showcase new technologies and capabilities that we intend to deploy and make available through our premium strategies and QuantDesk® our flagship cloud-based software.
My hope is that those of you who will be following us closely will gain a good understanding of Machine Learning techniques in statistical forecasting and will gain expertise in our suite of offerings and services.
Specifically:
- Forecaster - Pattern recognition price prediction
- Optimizer - Portfolio allocation based on risk profile
- Hedger - Hedge positions to reduce volatility and maximize risk adjusted return
- Event Analyzer - Identify predictable behavior following a meaningful event
- Back Tester - Assess an investment strategy through a historical test drive before risking capital
Your comments and questions are important to us and help to drive the content of this weekly briefing. I encourage you to continue to send us your feedback, your portfolios for analysis, or any questions you wish for us to showcase in future briefings.
Send your emails to: [email protected] and we will do our best to address each email received.
Please remember: This sample portfolio and the content delivered in this newsletter are for educational purposes only and NOT as the basis for one’s investment strategy. Beyond discounting market impact and not counting transaction costs, there are additional factors that can impact success. Hence, additional professional due diligence and investors’ insights should be considered prior to risking capital.
For those of you who are interested in the spreadsheet with all historical forecasts and results, please email me directly and I will gladly send you the data.
If you have any questions or comments on the above, please do not hesitate to email me directly.
Have a great week!

To conduct your own research on QuantDesk® please use the following links.
On Bloomberg:
APPS QFORE
APPS QOPTIM
APPS QHEDGE
APPS QEVENT
On The Web:
quantdesk.lucenaresearch.com
About Lucena Research
Lucena Research brings elite technology to hedge funds, investment professionals and wealth advisors. Our Artificial Intelligence decision support technology enables investment professionals to find market opportunities and to reduce risk in their portfolio.
We employ Machine Learning technology to help our customers exploit market opportunities with precision and scientifically validate their investment strategies before risking capital.
Disclaimer Pertaining to Content Delivered & Investment Advice
This information has been prepared by Lucena Research Inc. and is intended for informational purposes only. This information should not be construed as investment, legal and/or tax advice. Additionally, this content is not intended as an offer to sell or a solicitation of any investment product or service.
Please note: Lucena is a technology company and not a certified investment advisor. Do not take the opinions expressed explicitly or implicitly in this communication as investment advice. The opinions expressed are of the author and are based on statistical forecasting based on historical data analysis. Past performance does not guarantee future success. In addition, the assumptions and the historical data based on which an opinion is made could be faulty. All results and analyses expressed are hypothetical and are NOT guaranteed. All Trading involves substantial risk. Leverage Trading has large potential reward but also large potential risk. Never trade with money you cannot afford to lose. If you are neither a registered nor a certified investment professional this information is not intended for you. Please consult a registered or a certified investment advisor before risking any capital.