QuantDesk® Machine Learning Forecast
for the Week of August 3
Analysis
After a major selloff at the start to the week, stocks managed to reverse course and end mostly higher. Late last week, the commerce department reported that the second quarter’s GDP grew at an annualized rate of 2.3%. This was lower than the estimated 2.6%. In contrast, first quarter’s GDP was revised upwards from -0.2% to +0.6%.
Although CPI still remains benign, the steady momentum in GDP is evident enough to force the Feds to act later this year, ending a protracted zero-interest-rate era, which started in June 2008. An increase in consumer spending, the strengthening labor market, and a healthy housing market were the primary factors driving GDP growth. In contrast, oil prices remain weak, with US West Texas Intermediate and international Brent crude oil priced near $48 and $53 per barrel, respectively. The yield on the 10-year US Treasury note dipped to 2.2%, and the yield on Germany’s 10-year bund stood at 0.65%.
At Lucena, we had a mixed week. Tiebreaker took a short pause from its 6-week upwards streak and ended the week with a small drawdown of (-0.27%.). BlackDog ended the week higher by 1.38%, inching closer to its all-time high. The Dow Jones and the S&P both ended higher (0.69% and 1.19%, respectively).

Image 1: Last week’s change and Year to date gains.
For those of you unfamiliar with BlackDog and Tiebreaker, here is a brief overview:
BlackDog and Tiebreaker are two out of an assortment of model strategies that we deploy for our clients. Our team of quants is constantly on the hunt for innovative investment ideas. Lucena’s model portfolios are a byproduct of some of our best research, packaged into consumable model-portfolios. The performance stats and charts presented here are a reflection of live portfolios tracked on our platform, QuantDesk®. Actual performance of our clients’ portfolios may vary as it is subject to the manager’s discretionary implementation. We will be happy to facilitate an introduction to one of our clients for those of you interested in reviewing live brokerage accounts that track our model portfolios.
BlackDog:
BlackDog is a tactical asset allocation strategy that utilizes highly liquid ETFs of large cap and fixed income instruments. The portfolio is adjusted approximately once per month based on Lucena’s Optimizer in conjunction with Lucena’s macroeconomic ensemble voting model. Due to BlackDog’s low volatility (half the market in backtesting) we leveraged it 2X. By exposing twice its original cash assets, we take full advantage of its potential returns while maintaining market-relative low volatility and risk. As evidenced by the chart below, BlackDog 2X is substantially ahead of its benchmark (S&P 500).
BlackDog: Model portfolio performance compared to the S&P 500 from 4/1/2014 to 7/31/2015.
Past performance is no guarantee of future returns.
TieBreaker:
Tiebreaker is an actively managed market-neutral long/short equity strategy. It invests in equities from the S&P 500 and Russell 1000 and is rebalanced weekly using Lucena’s Forecaster and Optimizer. Tiebreaker splits its cash 50/50 between its core and hedge holdings, and its hedge positions consist of long and short equities identified by QuantDesk® Hedge Finder. Tiebreaker has been able to successfully avoid major market drawdowns while still taking full advantage of subsequent run-ups. The main factor that enables Tiebreaker to perform so well is its ability to adjust its long/short exposure based on idiosyncratic volatility and risk. Lucena’s Hedge Finder is primarily responsible for driving this long/short exposure tilt.
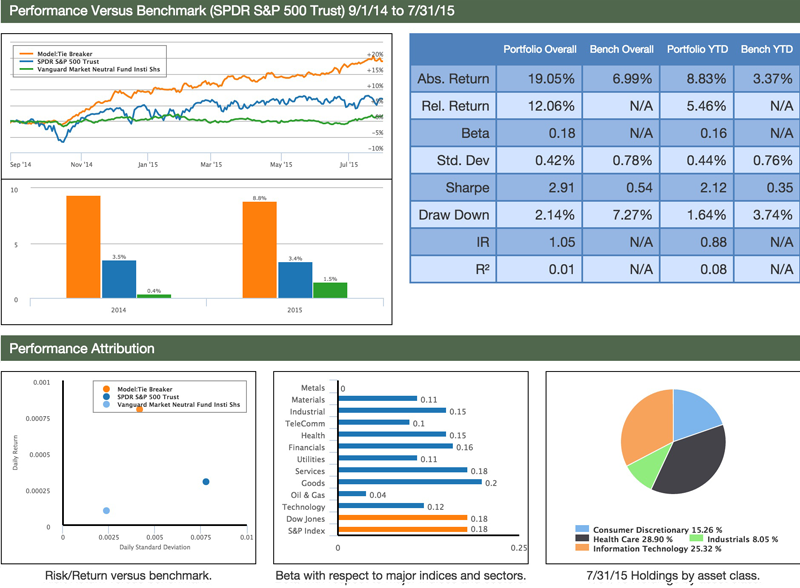
Tiebreaker: Model portfolio performance compared to S&P 500 and the Vanguard Market Neutral Institution fund VMNIX from 9/1/2014 to 7/31/2015.
Past performance is no guarantee of future returns.
I designed, backtested and deployed Tiebreaker utilizing QuantDesk® exclusively. This can serve as an example of how a portfolio manager can take full advantage of Lucena’s technology.
Bullpen - A Long Only Monthly-Rebalanced US Equity Strategy
This week, I wanted to tell you about a new strategy we’ve recently deployed in our family of model portfolios, called Bullpen. The inspiration to develop this strategy came from customers and prospects seeking an actively managed portfolio with a relatively low turnover and adherence to a long only mandate.
I believe it is important for me to convey the depth of research and work that goes into forming a production-ready strategy and Bullpen is a prime example.
Bullpen’s goals are:
- Identify long positions poised to outperform the SPY (benchmark) over a month’s (approximately 20 days) holding period.
- Utilize multi-factor models of macroeconomic, technical, and fundamental factors.
- Based on layered quantitative research utilizing genetic algorithms and proprietary event scans.
Goals: Market outperformance — both absolute and risk adjusted.
The research:
We have incorporated Lucena’s GA (Genetic Algorithm) technology to identify a collection of “nuggets.” I covered GoldDigger and the definition of a nugget in a previous newsletter but here is a brief overview:
Inspired from the natural selection process in which only the “best” of a population survives to reproduce. GoldDigger is a process running perpetually on Lucena’s designated servers attempting to identify a collection of indicators that together constitute a high statistical probability to predicting stocks’ price action. Lucena now employs over 400 factors in our database. There are virtually endless combinations of indicators that can constitute a model. GoldDigger uses an iterative evolutionary process to find which model is most predictable (or “fittest”). We call the fittest collection a “nugget.”
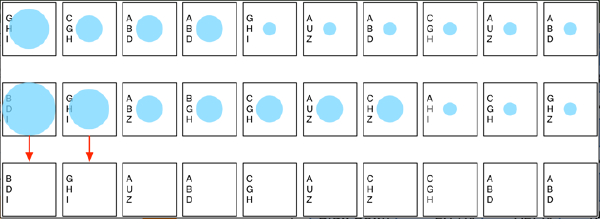
Image 1: Illustrates the GA process:
Randomly select three-factor models and sort them based on fitness scores. Allow only the top models to survive to the next generation and combine them with a new set of randomly selected three-factor models. Repeat the process until the same model remains at the top over several evolutionary cycles.
Using the process above, we identified event scans suited to signal stocks most prone to move higher in the next 20 days. Since we could have multiple discrete nuggets vote for different stocks at any given time, we developed another layer of ranking that identifies the single “best” stock to buy on a specific day.
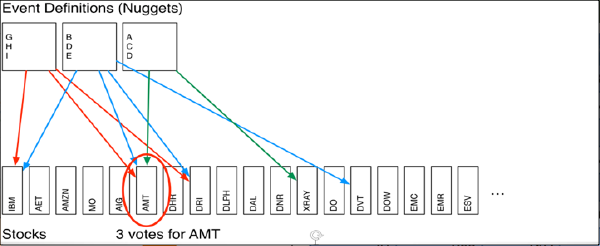
Image 2: Multiple nuggets vote for various stocks. Votes are tallied up to yield the single best selection.
We have incorporated the following strategy into a backtest:
- Every trading day buy one stock and hold for 20 days.
- At the end of day one, the portfolio will hold one stock at 5%.
- At the end of day two, the portfolio will hold two stocks combined at 10%.
- By the end of day 20, the portfolio will hold 20 positions at 100% exposure.
- On day 21, the first position exits and a new position is entered (the portfolio is limited not to exceed 20 positions).
- Each position is restricted by the following:
- Maximum allocation per positions (not to exceed 10% for example).
- Strict stop loss/ target gain guidelines.
- Additional diversification rules to restrict overexposure to a single sector for example.
Below is the result of a backtest conducted between 1/1/2004 and 7/20/2015.
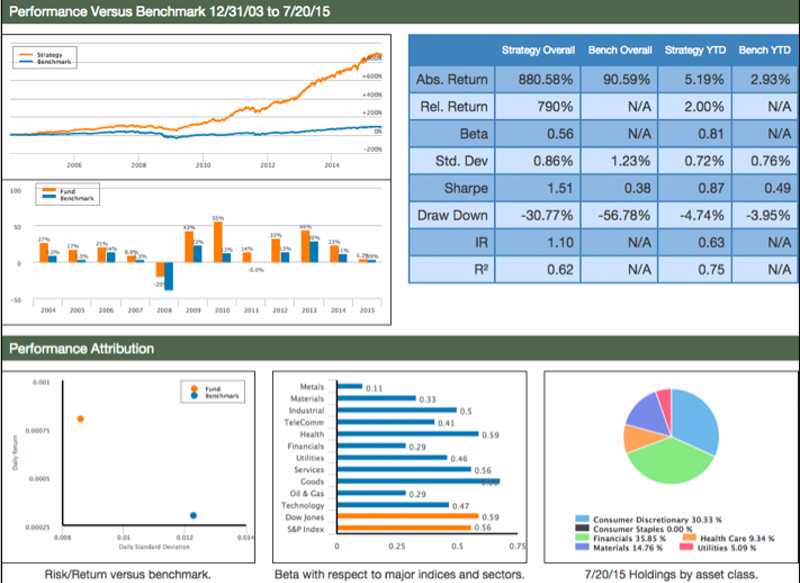
Image 3: Bullpen backtest performance report
As you can see, the backtest points to outperformance over the S&P every year. This begs the question: Can we provide better protection to Bullpen by incorporating hedging the long leg with an equal-weight hedge of shorting SPY (or buying SH, the SPY short ETF)?
The backtest below demonstrates how incorporating a SPY short hedge affects the portfolio.
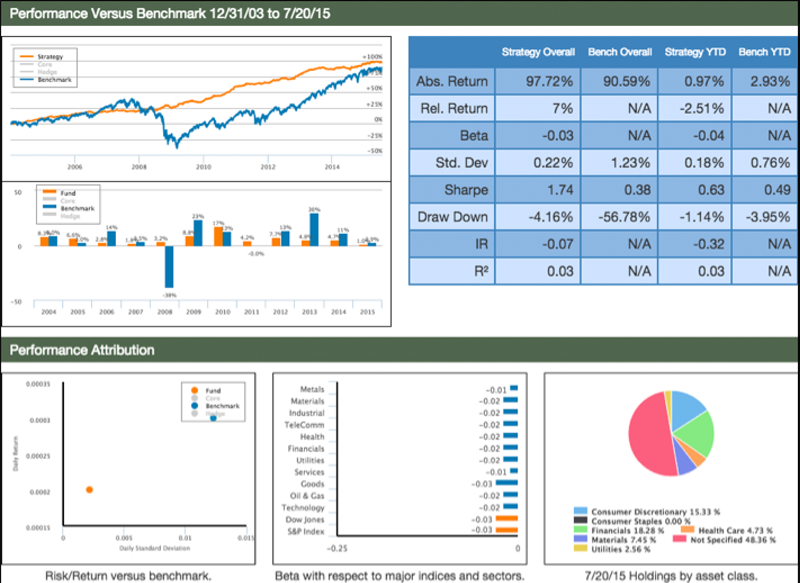
Image 4: Bullpen hedged with shorting SPY or buying SH. We achieved a favorable Sharpe of 1.74 with an astounding low volatility and a max drawdown of -4.16%
If you’d like more information on Bullpen, please email me and I will be happy to answer any questions you may have.
In the past year, we covered QuantDesk’s Forecaster, Back-tester, Optimizer, Hedger and our Event Study. In future briefings, we will keep you up-to-date on how our live portfolios are executing. We will also showcase new technologies and capabilities that we intend to deploy and make available through our premium strategies and QuantDesk® our flagship cloud-based software.
My hope is that those of you who will be following us closely will gain a good understanding of Machine Learning techniques in statistical forecasting and will gain expertise in our suite of offerings and services.
Specifically:
- Forecaster - Pattern recognition price prediction
- Optimizer - Portfolio allocation based on risk profile
- Hedger - Hedge positions to reduce volatility and maximize risk adjusted return
- Event Analyzer - Identify predictable behavior following a meaningful event
- Back Tester - Assess an investment strategy through a historical test drive before risking capital
Your comments and questions are important to us and help to drive the content of this weekly briefing. I encourage you to continue to send us your feedback, your portfolios for analysis, or any questions you wish for us to showcase in future briefings.
Send your emails to: [email protected] and we will do our best to address each email received.
Please remember: This sample portfolio and the content delivered in this newsletter are for educational purposes only and NOT as the basis for one’s investment strategy. Beyond discounting market impact and not counting transaction costs, there are additional factors that can impact success. Hence, additional professional due diligence and investors’ insights should be considered prior to risking capital.
For those of you who are interested in the spreadsheet with all historical forecasts and results, please email me directly and I will gladly send you the data.
If you have any questions or comments on the above, please do not hesitate to email me directly.
Have a great week!

To conduct your own research on QuantDesk® please use the following links.
On Bloomberg:
APPS QFORE
APPS QOPTIM
APPS QHEDGE
APPS QEVENT
On The Web:
quantdesk.lucenaresearch.com
About Lucena Research
Lucena Research brings elite technology to hedge funds, investment professionals and wealth advisors. Our Artificial Intelligence decision support technology enables investment professionals to find market opportunities and to reduce risk in their portfolio.
We employ Machine Learning technology to help our customers exploit market opportunities with precision and scientifically validate their investment strategies before risking capital.
Disclaimer Pertaining to Content Delivered & Investment Advice
This information has been prepared by Lucena Research Inc. and is intended for informational purposes only. This information should not be construed as investment, legal and/or tax advice. Additionally, this content is not intended as an offer to sell or a solicitation of any investment product or service.
Please note: Lucena is a technology company and not a certified investment advisor. Do not take the opinions expressed explicitly or implicitly in this communication as investment advice. The opinions expressed are of the author and are based on statistical forecasting based on historical data analysis. Past performance does not guarantee future success. In addition, the assumptions and the historical data based on which an opinion is made could be faulty. All results and analyses expressed are hypothetical and are NOT guaranteed. All Trading involves substantial risk. Leverage Trading has large potential reward but also large potential risk. Never trade with money you cannot afford to lose. If you are neither a registered nor a certified investment professional this information is not intended for you. Please consult a registered or a certified investment advisor before risking any capital.