QuantDesk® Machine Learning Forecast
for the Week of August 24
Analysis
Tiebreaker, our market-neutral strategy, had one of its best performances last week. Market-neutral is defined in Wikipedia as follows: “An investment strategy or portfolio is considered market-neutral if it seeks to avoid some form of market risk entirely, typically by hedging.” Over the course of the past two years or so, we have been advocating various techniques, powered by quantitative analysis, that are geared toward identifying investment opportunities while managing risk. Tiebreaker was designed specifically to withstand the irrational market selloff that we witnessed last week. Given the statistical significance quantitative investments seek to exploit, most are designed for normal market conditions and the accompanying expected behavior. Seasoned investment professionals commonly state that the single factor most responsible for significant losses in the stock market after greed is arrogance. It is astonishing to see “astute” investors ignore the risk of a rare, yet substantially harmful, market-wide selloff.
Specific to Tiebreaker, in addition to the long/short hedge, we’ve incorporated portfolio optimization, and strict stop loss/target gain trade execution geared toward minimizing draw down exposure. Our backtest simulation engine provides invaluable insight into the behavior of Tiebreaker during the market corrections and the recession the US market endured in the last decade. There is truly no way to consistently achieve market outperformance without risk. By definition, expectations of market relative return are always commensurate with market risk. However, I strongly believe that any investment strategy should consider guidelines for taking chips off the table.
Today, in addition to our normal weekly update on Tiebreaker and BlackDog, I wanted to briefly demonstrate how Tiebreaker’s live performance matches the backtest we conducted since 1/1/2004.
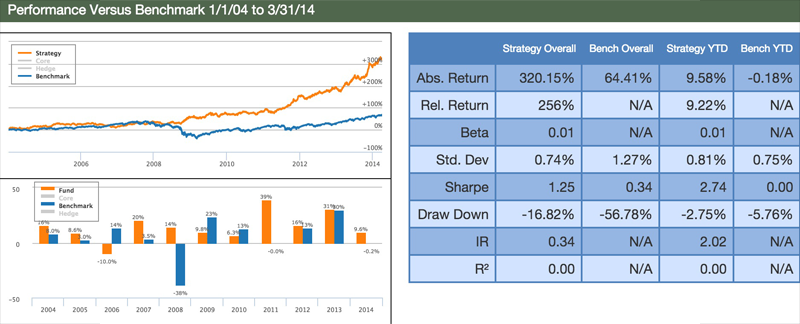
Image 1: Tiebreaker’s (in orange) vs. benchmark S&P (in blue) backtest between 1/1/2004 and 3/31/2015
While past performance is no guarantee of future returns, please note the strong market-relative performance during 2008 and 2011 (recession and correction years). In addition, see Tiebreaker’s lower drawdown relative to the benchmark in the summary table on the right.
In addition, I wanted to underscore Tiebreaker’s performance specifically during last week’s market selloff. Consistent with the backtest, Tiebreaker was able to generate significant alpha last week.
Image 2: Tiebreaker model portfolio’s performance. See divergence from the benchmark during last week’s market selloff, propelling Tiebreaker to close at a new all-time high.
The power behind Tiebreaker is its ability to take profits early. It minimizes its exposure by not staying in a position too long. Leaving money on the table by exiting prematurely is completely acceptable to Tiebreaker since it ends up profiting handsomely in the long run.
China’s Yuan devaluation and its disappointing CPI report fueled growing concern that its economic slowdown would weigh heavily on global growth and commodity prices. The major benchmarks experienced their largest weekly declines since 2011. Emerging markets’ currencies plummeted, which added to the fear of a global currency war doomed to negatively affect the profits and competitiveness of US companies conducting business abroad. Resulting from last week’s selloff, the broad market’s benchmarks ended in negative territory for the year while the Dow and the Russell 2000 entered correction territory by declining more than 10% from their highs.
At Lucena, BlackDog could not avoid the broad decline and ended the week lower by 5.15%, however, still 62 bps better than the market, which ended the week down by 5.77%.
Tiebreaker, in contrast had a strong week, up by +2.58%, reaching yet another all time high.

Image 3: Last week’s change and Year to date gains.
For those of you unfamiliar with BlackDog and Tiebreaker, here is a brief overview:
BlackDog and Tiebreaker are two out of an assortment of model strategies that we deploy for our clients. Our team of quants is constantly on the hunt for innovative investment ideas. Lucena’s model portfolios are a byproduct of some of our best research, packaged into consumable model-portfolios. The performance stats and charts presented here are a reflection of live portfolios tracked on our platform, QuantDesk®. Actual performance of our clients’ portfolios may vary as it is subject to the manager’s discretionary implementation. We will be happy to facilitate an introduction to one of our clients for those of you interested in reviewing live brokerage accounts that track our model portfolios.
BlackDog:
BlackDog is a tactical asset allocation strategy that utilizes highly liquid ETFs of large cap and fixed income instruments. The portfolio is adjusted approximately once per month based on Lucena’s Optimizer in conjunction with Lucena’s macroeconomic ensemble voting model. Due to BlackDog’s low volatility (half the market in backtesting) we leveraged it 2X. By exposing twice its original cash assets, we take full advantage of its potential returns while maintaining market-relative low volatility and risk. As evidenced by the chart below, BlackDog 2X is substantially ahead of its benchmark (S&P 500).
BlackDog: Model portfolio performance compared to the S&P 500 from 4/1/2014 to 8/28/2015.
Past performance is no guarantee of future returns.
TieBreaker:
Tiebreaker is an actively managed market-neutral long/short equity strategy. It invests in equities from the S&P 500 and Russell 1000 and is rebalanced weekly using Lucena’s Forecaster and Optimizer. Tiebreaker splits its cash 50/50 between its core and hedge holdings, and its hedge positions consist of long and short equities identified by QuantDesk® Hedge Finder. Tiebreaker has been able to successfully avoid major market drawdowns while still taking full advantage of subsequent run-ups. The main factor that enables Tiebreaker to perform so well is its ability to adjust its long/short exposure based on idiosyncratic volatility and risk. Lucena’s Hedge Finder is primarily responsible for driving this long/short exposure tilt.

Tiebreaker: Model portfolio performance compared to S&P 500 and the Vanguard Market Neutral Institution fund VMNIX from 9/1/2014 to 8/28/2015.
Past performance is no guarantee of future returns.
I designed, backtested and deployed Tiebreaker utilizing QuantDesk® exclusively. This can serve as an example of how a portfolio manager can take full advantage of Lucena’s technology.
Lucena is coming to a city near you!
Dr. Tucker Balch and I will be traveling to San Francisco in early September and Chicago in mid September. If you are or happen to be in San Francisco and Chicago and would like to meet us, please contact us at [email protected] and we will let you know where we will be presenting.
In the past year, we covered QuantDesk’s Forecaster, Back-tester, Optimizer, Hedger and our Event Study. In future briefings, we will keep you up-to-date on how our live portfolios are executing. We will also showcase new technologies and capabilities that we intend to deploy and make available through our premium strategies and QuantDesk® our flagship cloud-based software.
My hope is that those of you who will be following us closely will gain a good understanding of Machine Learning techniques in statistical forecasting and will gain expertise in our suite of offerings and services.
Specifically:
- Forecaster - Pattern recognition price prediction
- Optimizer - Portfolio allocation based on risk profile
- Hedger - Hedge positions to reduce volatility and maximize risk adjusted return
- Event Analyzer - Identify predictable behavior following a meaningful event
- Back Tester - Assess an investment strategy through a historical test drive before risking capital
Your comments and questions are important to us and help to drive the content of this weekly briefing. I encourage you to continue to send us your feedback, your portfolios for analysis, or any questions you wish for us to showcase in future briefings.
Send your emails to: [email protected] and we will do our best to address each email received.
Please remember: This sample portfolio and the content delivered in this newsletter are for educational purposes only and NOT as the basis for one’s investment strategy. Beyond discounting market impact and not counting transaction costs, there are additional factors that can impact success. Hence, additional professional due diligence and investors’ insights should be considered prior to risking capital.
For those of you who are interested in the spreadsheet with all historical forecasts and results, please email me directly and I will gladly send you the data.
If you have any questions or comments on the above, please do not hesitate to email me directly.
Have a great week!

To conduct your own research on QuantDesk® please use the following links.
On Bloomberg:
APPS QFORE
APPS QOPTIM
APPS QHEDGE
APPS QEVENT
On The Web:
quantdesk.lucenaresearch.com
About Lucena Research
Lucena Research brings elite technology to hedge funds, investment professionals and wealth advisors. Our Artificial Intelligence decision support technology enables investment professionals to find market opportunities and to reduce risk in their portfolio.
We employ Machine Learning technology to help our customers exploit market opportunities with precision and scientifically validate their investment strategies before risking capital.
Disclaimer Pertaining to Content Delivered & Investment Advice
This information has been prepared by Lucena Research Inc. and is intended for informational purposes only. This information should not be construed as investment, legal and/or tax advice. Additionally, this content is not intended as an offer to sell or a solicitation of any investment product or service.
Please note: Lucena is a technology company and not a certified investment advisor. Do not take the opinions expressed explicitly or implicitly in this communication as investment advice. The opinions expressed are of the author and are based on statistical forecasting based on historical data analysis. Past performance does not guarantee future success. In addition, the assumptions and the historical data based on which an opinion is made could be faulty. All results and analyses expressed are hypothetical and are NOT guaranteed. All Trading involves substantial risk. Leverage Trading has large potential reward but also large potential risk. Never trade with money you cannot afford to lose. If you are neither a registered nor a certified investment professional this information is not intended for you. Please consult a registered or a certified investment advisor before risking any capital.