QuantDesk® Machine Learning Forecast
for the Week of August 10
Analysis
In anticipation of the Federal Reserve rate hike in September, we have entered a rather peculiar period in which any news, good or bad, puts pressure on stocks. Stemming from uncertainty, good news increases the likelihood of a Fed tightening while bad news points to weaker than expected market conditions. Last week underscored an uncharacteristic divergence between the US broad market, which slid, and the European market, which ended the week solidly higher. Asian shares ended mixed. As the earnings season continues to unfold, investors’ mindset resulting from disappointing earnings or lower estimates for next quarter remains somber. Tumbling oil prices continue to put pressure on large-cap energy stocks. Media and cable stocks attributed earnings disappointment to their stocks’ slump on Friday.
At Lucena, we had a positive week. While BlackDog lost (-24) bp’s, it was well ahead of the major indexes generating 1%+ of alpha. Tiebreaker ended the week up +79 bp’s, bucking the trend and capitalizing on its market neutral stands.

Image 1: Last week’s change and Year to date gains.
For those of you unfamiliar with BlackDog and Tiebreaker, here is a brief overview:
BlackDog and Tiebreaker are two out of an assortment of model strategies that we deploy for our clients. Our team of quants is constantly on the hunt for innovative investment ideas. Lucena’s model portfolios are a byproduct of some of our best research, packaged into consumable model-portfolios. The performance stats and charts presented here are a reflection of live portfolios tracked on our platform, QuantDesk®. Actual performance of our clients’ portfolios may vary as it is subject to the manager’s discretionary implementation. We will be happy to facilitate an introduction to one of our clients for those of you interested in reviewing live brokerage accounts that track our model portfolios.
BlackDog:
BlackDog is a tactical asset allocation strategy that utilizes highly liquid ETFs of large cap and fixed income instruments. The portfolio is adjusted approximately once per month based on Lucena’s Optimizer in conjunction with Lucena’s macroeconomic ensemble voting model. Due to BlackDog’s low volatility (half the market in backtesting) we leveraged it 2X. By exposing twice its original cash assets, we take full advantage of its potential returns while maintaining market-relative low volatility and risk. As evidenced by the chart below, BlackDog 2X is substantially ahead of its benchmark (S&P 500).
BlackDog: Model portfolio performance compared to the S&P 500 from 4/1/2014 to 8/7/2015.
Past performance is no guarantee of future returns.
TieBreaker:
Tiebreaker is an actively managed market-neutral long/short equity strategy. It invests in equities from the S&P 500 and Russell 1000 and is rebalanced weekly using Lucena’s Forecaster and Optimizer. Tiebreaker splits its cash 50/50 between its core and hedge holdings, and its hedge positions consist of long and short equities identified by QuantDesk® Hedge Finder. Tiebreaker has been able to successfully avoid major market drawdowns while still taking full advantage of subsequent run-ups. The main factor that enables Tiebreaker to perform so well is its ability to adjust its long/short exposure based on idiosyncratic volatility and risk. Lucena’s Hedge Finder is primarily responsible for driving this long/short exposure tilt.
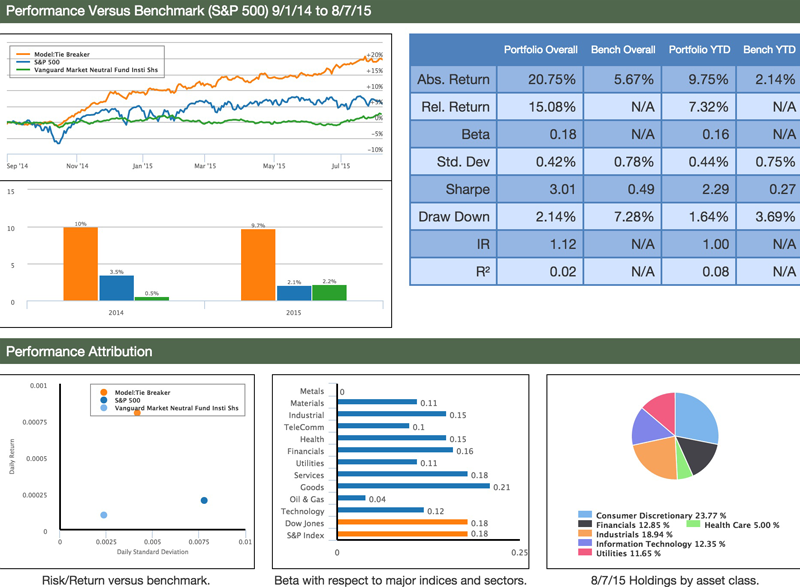
Tiebreaker: Model portfolio performance compared to S&P 500 and the Vanguard Market Neutral Institution fund VMNIX from 9/1/2014 to 8/7/2015.
Past performance is no guarantee of future returns.
I designed, backtested and deployed Tiebreaker utilizing QuantDesk® exclusively. This can serve as an example of how a portfolio manager can take full advantage of Lucena’s technology.
Pair Trading - A unique flavor of statistical arbitrage
Taken directly from Investopedia, pair trading is defined as: “A market-neutral trading strategy that matches a long position with a short position in a pair of highly correlated instruments such as two stocks, exchange-traded funds (ETFs), currencies, commodities or options. Pair’s traders wait for weakness in the correlation, and then go long on the under-performer while simultaneously going short on the over-performer, closing the positions as the relationship returns to its statistical norm.”
Today, I want to show you how QuantDesk’s portfolio replication technology can be utilized to form a sound pair-trading strategy.
I will demonstrate the following:
- How to identify suitable pairs.
- How to identify entry and exit conditions geared to increase the likelihood of success.
The premise behind our pair strategy is that highly correlated stocks experience very similar price action over time. For example, when one stock gaps higher it is very likely that its pair moves with the same velocity and direction. There are times, however, when two highly correlated stocks temporarily lose their correlation, or act independent of each other. Depending on how significant the divergence from the normal correlation is, the strategy is geared to exploit this temporary inefficiency and profit when the two stocks move back to their normal highly correlated state.
Below is an image taken directly form QuantDesk’s portfolio replication module. I entered Exxon Mobile (XOM) as the source instrument and instructed the software to identify another stock (its highly correlated pair) from the S&P 500 (white list). You can see how I prevented the replication-engine from selecting XOM as the most highly correlated stock by adding it to the exclusion list (black list).
Not surprisingly, the portfolio replication selected Chevron Corp (CVX). As can be seen in the image below both stocks, XOM and CVX, move very similarly over time. In addition, the points of divergence and convergence are also clearly depicted.
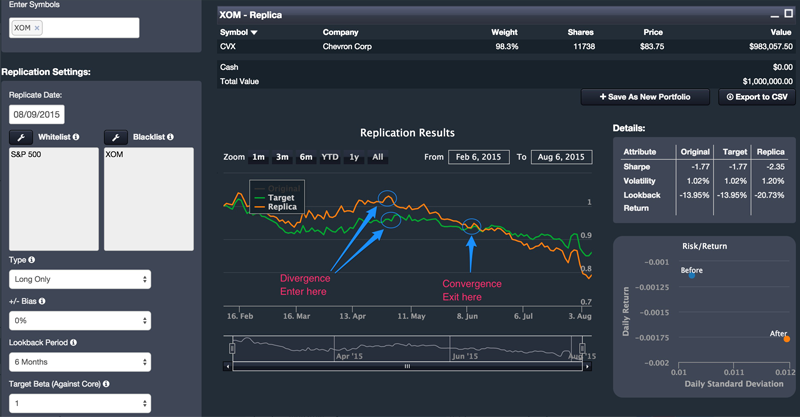
Image 1: Demonstrates 2 highly correlated stocks XOM and CVX. We identify price inefficiency when correlation breaks down. Hence, when XOM and CVX price diverges from their anticipated correlated state price.
Our assumption was that correlation should resume in the near future, as it evidently has. In anticipation of this we sold short the stock that diverged upwards and bought long the stock that diverged downwards. Consequently, we took profit when the stocks’ prices converged back.
Obviously, the concept depicted here is merely a single case. QuantDesk®, along with Lucena’s other offerings, can provide more comprehensive research by which we incorporate extensive backtesting and simulation in different market conditions. Specifically, we attempt to identify what constitutes a most-likely-to-succeed pairs trading scenario. For example, the optimal divergence point for entry and the optimal profit-taking point. We also conduct research in order to identify the conditions in which holding on to our pair positions is no longer profitable, and hence exiting our trades is recommended in order to minimize losses.
If you’d like a demo of Lucena’s portfolio replication please feel free to reach out to us and we will gladly demonstrate this powerful capability.
In the past year, we covered QuantDesk’s Forecaster, Back-tester, Optimizer, Hedger and our Event Study. In future briefings, we will keep you up-to-date on how our live portfolios are executing. We will also showcase new technologies and capabilities that we intend to deploy and make available through our premium strategies and QuantDesk® our flagship cloud-based software.
My hope is that those of you who will be following us closely will gain a good understanding of Machine Learning techniques in statistical forecasting and will gain expertise in our suite of offerings and services.
Specifically:
- Forecaster - Pattern recognition price prediction
- Optimizer - Portfolio allocation based on risk profile
- Hedger - Hedge positions to reduce volatility and maximize risk adjusted return
- Event Analyzer - Identify predictable behavior following a meaningful event
- Back Tester - Assess an investment strategy through a historical test drive before risking capital
Your comments and questions are important to us and help to drive the content of this weekly briefing. I encourage you to continue to send us your feedback, your portfolios for analysis, or any questions you wish for us to showcase in future briefings.
Send your emails to: [email protected] and we will do our best to address each email received.
Please remember: This sample portfolio and the content delivered in this newsletter are for educational purposes only and NOT as the basis for one’s investment strategy. Beyond discounting market impact and not counting transaction costs, there are additional factors that can impact success. Hence, additional professional due diligence and investors’ insights should be considered prior to risking capital.
For those of you who are interested in the spreadsheet with all historical forecasts and results, please email me directly and I will gladly send you the data.
If you have any questions or comments on the above, please do not hesitate to email me directly.
Have a great week!

To conduct your own research on QuantDesk® please use the following links.
On Bloomberg:
APPS QFORE
APPS QOPTIM
APPS QHEDGE
APPS QEVENT
On The Web:
quantdesk.lucenaresearch.com
About Lucena Research
Lucena Research brings elite technology to hedge funds, investment professionals and wealth advisors. Our Artificial Intelligence decision support technology enables investment professionals to find market opportunities and to reduce risk in their portfolio.
We employ Machine Learning technology to help our customers exploit market opportunities with precision and scientifically validate their investment strategies before risking capital.
Disclaimer Pertaining to Content Delivered & Investment Advice
This information has been prepared by Lucena Research Inc. and is intended for informational purposes only. This information should not be construed as investment, legal and/or tax advice. Additionally, this content is not intended as an offer to sell or a solicitation of any investment product or service.
Please note: Lucena is a technology company and not a certified investment advisor. Do not take the opinions expressed explicitly or implicitly in this communication as investment advice. The opinions expressed are of the author and are based on statistical forecasting based on historical data analysis. Past performance does not guarantee future success. In addition, the assumptions and the historical data based on which an opinion is made could be faulty. All results and analyses expressed are hypothetical and are NOT guaranteed. All Trading involves substantial risk. Leverage Trading has large potential reward but also large potential risk. Never trade with money you cannot afford to lose. If you are neither a registered nor a certified investment professional this information is not intended for you. Please consult a registered or a certified investment advisor before risking any capital.